Inflation Data: The Tipping Point for U.S. Stocks?
12-09-2023
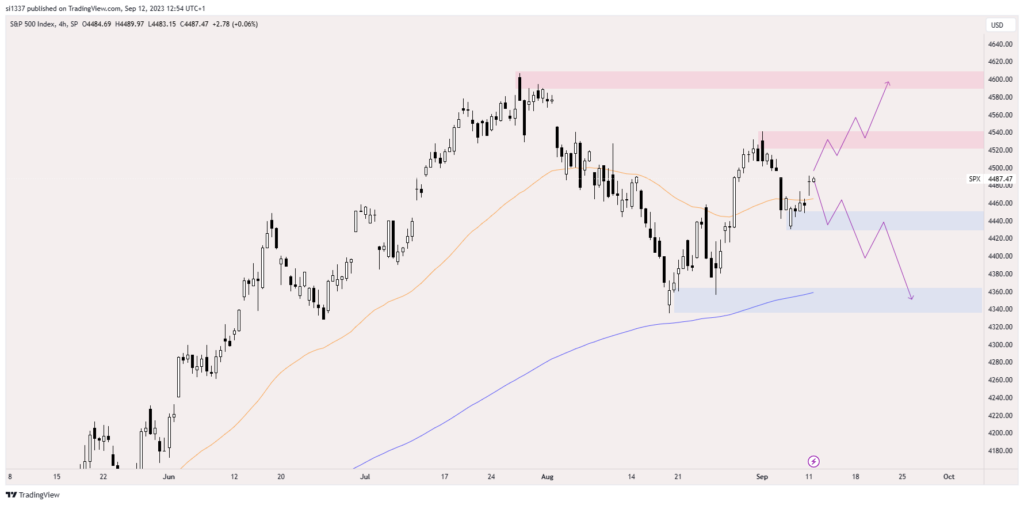
U.S. equity investors will be closely watching the upcoming inflation figures this week, the outcome could shape the trajectory of the stock rally that has shown signs of faltering lately.
The U.S. economy appears poised for a ‘soft landing’, wherein the Federal Reserve manages to curb inflation without seriously impacting growth. This has contributed to a 16% rise in the S&P 500 so far this year.
In addition to inflation data, investors will also be eyeing other recent economic indicators from last week, such as the producer price index and retail sales stats, to gauge potential moves by the Fed.
Market expectations hint at the U.S. central bank keeping interest rates unchanged. However, the likelihood of a rate increase in the November meeting has risen to almost 44%, up from 28% a month earlier.
Randy Frederick of the Schwab Centre for Financial Research commented, “A surge in inflation numbers would escalate the rate hike expectations for both September and November.”
Despite the recent market uncertainties, many strategists and investors maintain a positive outlook. Factors fuelling this optimism include the U.S. economy’s strong performance in comparison to Europe and China, and evidence suggesting that the profit downturn among S&P 500 firms may be ending.
However, concerns regarding China’s economic deceleration and the potential narrowing of U.S. corporate profit margins have some believing that pushing stocks for higher returns might become challenging.
The S&P 500’s tech sector faced a 2% decline this week after reports emerged that Beijing directed its central government staff to refrain from using iPhones. As a result, Apple’s stock dropped by 6%, sparking concerns over how competition from China’s Huawei might impact the tech giant and its affiliates.
The consensus seems to be that if we get a high inflation print over the 3.6% that has been forecasted equity markets will take this as a bad as further tightening will be needed to tame inflation, whereas if we see a lower-than-expected print equity markets could rally quite strongly.

Call Option
Trade Idea
Bullish Trade
BUY 1 E-MINI S&P 500 (13/09/23) 4480 Call @ 17
SELL 1 E-MINI S&P 500 (13/09/23) 4525 Call @ 2.90
Net cost of trade: 17- 2.90 = 14.10 x $50 underlying: $705
Max Profit: 4525-4480= 45 x $50 underling = $2,250 – $705 initial debit
($1,500)
Put Option
Trade Idea
Bearish Trade
BUY 1 E-MINI S&P 500 (13/09/23) 4480 Put @ 16.50
SELL 1 E-MINI S&P 500 (13/09/23) 4435 Put @ 3.50
Net cost of trade: 16.50- 3.50 = 13 x $50 underlying: $650
Max Profit: 4480-4435= 45 x $50 underling = $2,250 – $650 initial debit
($1,600)


