Gold as a Safe Haven: Navigating Uncertainty and Market Volatility
20-06-2023
Gold prices experienced a decline across Asia and Europe on Thursday, an outcome reflective of markets globally adjusting to the US Federal Reserve’s expected decision to halt its prolonged cycle of interest-rate hikes, made in the previous session.
The stalling of interest-rate escalation, which often adversely impacts non-yielding assets such as gold, was interpreted as an encouraging development in the gold market.
Jerome Powell, the Federal Reserve Chair, is once more slated to command attention this week. On the calendar is his semi-annual monetary policy report, set to be presented to the House Financial Services Committee on Wednesday, June 21st, followed by the Senate Banking Committee on Thursday, June 22nd. Powell is anticipated to reiterate the comments made during his post-meeting press conference. Although cautious in tone, his remarks left the door ajar for the possibility of two more rate increases.
For investors and the gold market, the prospect of the US nearing the cessation of its monetary tightening cycle serves as an especially bright beacon of hope. Given that markets remain acutely attuned to any fluctuations in rate hike expectations, Powell’s upcoming testimony holds significant potential to ignite volatility. This is particularly true if he provides any new indicators regarding the Fed’s forthcoming actions.
Central bank buying
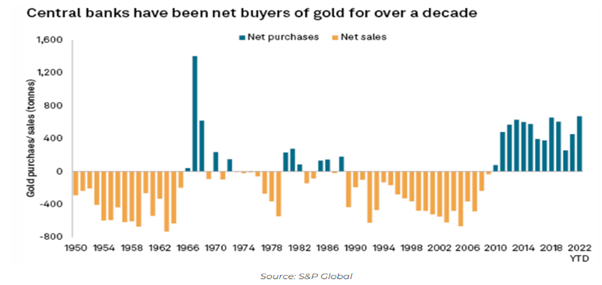
Central banks appear to be anticipating a possible surge in gold values, as evidenced by their acquisition of over 1130 tonnes of the precious metal, a dramatic increase of 150% compared to the previous year. In the first quarter of this year alone, they’ve added a further 228 tonnes to their reserves, setting a new record for Q1 purchases.
This strategic stockpiling appears to be a response to the prevailing economic and geopolitical uncertainties of our time. The recent conflict in Ukraine and the subsequent imposition of sanctions on Russia have prompted many central banks, particularly those not aligned with the mainstream, to fortify their financial stability by increasing their gold reserves.

Recession risk
Joyce Chang, the Chair of Global Research at JPMorgan, recently voiced a cautionary observation on social media, suggesting that equity markets are ‘priced to perfection’. She elaborated, stating, “Should equity markets adjust to factor in a rise in inflation volatility at levels mirroring those currently reflected in bond markets, this could indicate a downside of around 20% from the current figures.”
A warning sign for a potential U.S. recession has been quietly flickering since mid-2022 for discerning investors. This signal is the ‘yield curve inversion’, a scenario where the yield on 2-year U.S. Treasury notes surpasses that of the 10-year Treasury notes.
Historically, an inverted yield curve is considered a robust indicator of an impending economic recession. In two-thirds of instances when the yield curve has inverted, the U.S. economy has slipped into a recession within the ensuing 18 months.
The last occurrence of a yield curve inversion was towards the end of 2019, mere months before the onset of the Covid-19 recession. In a noteworthy development, the yield curve in early 2023 inverted to its most profound level since 1981.
Technical analysis
Weekly Chart Analysis:
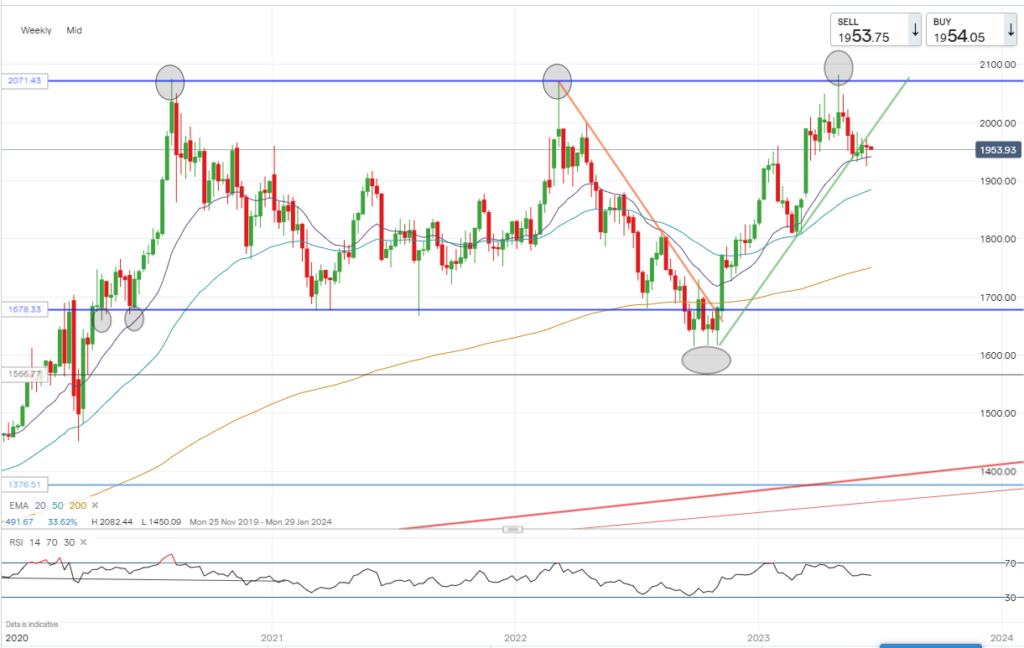
Spot gold has consistently encountered strong resistance around the $2070/80 mark, a barrier it failed to surpass on three separate occasions: August 6th, 2020, March 8th, 2021, and most recently on May 3rd. This recurring pattern could potentially signal a ‘triple top’ formation, typically associated with a market reversal.
However, in order to confirm this pattern as indicative of a reversal, the price would need to be hovering around the $1650/1700 mark, which is currently not the case. Gold is trading at a level consistent with its trend support and is also finding support from the 20-week Exponential Moving Average (EMA). Furthermore, the price is solidly positioned above the 50-week EMA, lending additional strength to the current trend.
week and the 200w EMAs, this is showing that the broader longer-term uptrend is still intact.

Daily Chart Analysis:
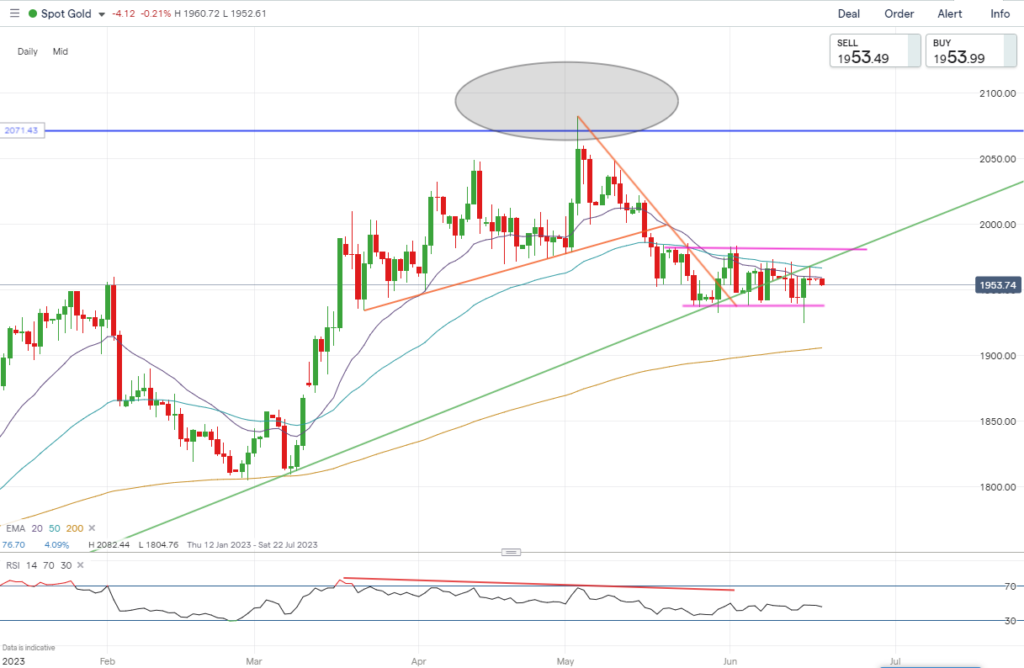
Following the recent repulsion at the $2082-mark, gold’s value has receded to $1925, establishing a robust support level. This support zone has initiated a consolidation phase for gold, oscillating between $1925 and $1983. The resolution of this consolidation period will be instrumental in determining the future price trajectory, as the market currently grapples with ambiguity regarding its direction. As this phase evolves, market participants are keenly observing to identify the resultant trend. If the break is upwards, it would confirm the persistence of the current trend, potentially setting the stage for a fourth attempt to breach the $2070/80 zone, and the prospect of setting new record highs.
However, if the trend breaks to the downside, breaching the lower limit of the consolidation, it could lead to an extension of the pullback, potentially taking the price down to the $1906 mark, corresponding to the 200-day Exponential Moving Average (EMA).

Long Call Spread
Long Call Spread
Net debit $43 ($14,000-$5400= $8600)
Potential profit 150*100*2- 8600= $21,400
Long call option
SPDR Gold Trust (GLD) long OTM calls
GLD $180.89
(7.70 X 100 X 10 lots)
Total consideration $7,700
Long call option
Newmont Corporation (NEM)
Newmont Corporation (NEM)
NEM $43.50
(4.37 x 100 X 10 lots)
Total consideration $4,370


