Riding the Bullion or Sinking with the Ship?
15-05-2023
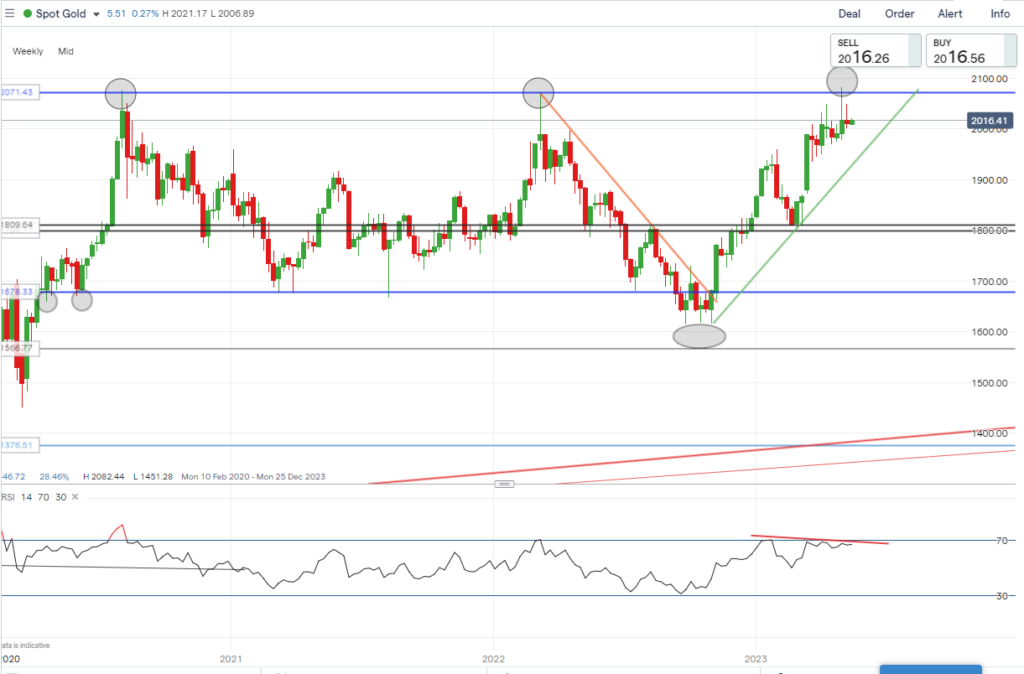
In early May, gold experienced a significant surge, reaching its multi-year high at $2082. The $2070/82 range has proven to be a crucial resistance level, causing the price to decline with each test. The first swing high was printed in August 2020 reaching a high of $2075.32.
Subsequently, the market was dominated by bearish sentiment, leading to a decline in gold’s value to as low as $1676 by March 2021. The second assault on the $2070 level was a year later where once again bearish sentiment took the market lower to $1614 by late September 2022 where price consolidated for 6 weeks before making its ascent to the third test of the $2070 level earlier this month.

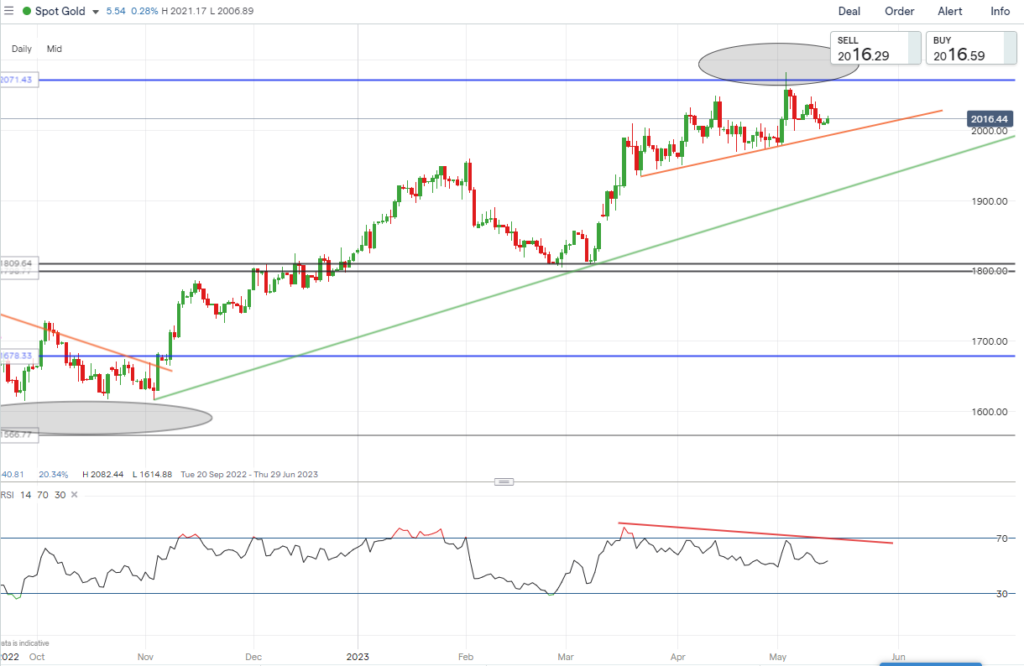
Currently, gold has retraced from this peak but remains comfortably above the $2000 level, maintaining an upward trend.
However, there is some caution to be had with this rising trend on the daily chart. It is noticeable that while the price has been gradually rising, the RSI has been gradually falling, suggesting a potential failure in the trend and the likelihood of a correction. This bearish divergence can also be seen in the weekly chart, albeit very slight.
In the event of a market decline, there is substantial support from the rising trend originating from the lows of late 2022.
Key short-term support levels follow
- $2000
- $1972 This would be a test of the rising trend
- $1950
- $1905 This is a 38.2% retracement for the entire move higher
- $1986 50 EMA
Key short-term resistance
- $2040
- $2056
- $2082

Call Spread
Bullish Trade
2060/2200 Call Spread
Debit of $39.5 x Contract size of $100= $3950
Potential profit $14,000- $3950= $10,050
Put Spread
Bearish Trade
2060/1920 Put Spread
Debit of $53 x Contract size of $100= $5300
Potential Profit $14,000- $5300= $8700
