Sterling Takes A Tumble
GBP/USD – 07/10/22
2022 has been a horrid year for the Pound. From its high to its low, thus far, against the greenback the pound has lost 24.7% of its value. This has been in the face of higher inflation, aggressive central bank monetary tightening and poorly received fiscal policy from Kwasi Kwarteng’s mini, not so mini budget, which knocked the pound to its lowest level, not seen since 1985 (1.0355)
The pound has recovered from this reactionary low to 1.11 but is still far from its 2022 high of 1.3750. As investors look to re price UK assets and its currency amid rising inflation, higher interest rates, and loose fiscal policy it is giving traders an opportunity to ride the current volatility.
Below is the daily chart of the pound against the dollar for 2022. It is evident from the chart that current trend for [tooltip tip=”The term cable is a term used by traders to refer to the exchange rate between the pound and US dollar. The term originated when the exchange rate between the US dollar and sterling began to be transmitted across the Atlantic by an actual cable. Since that time the exchange rate has been referred to as the cable “]cable[/tooltip] is bearish.
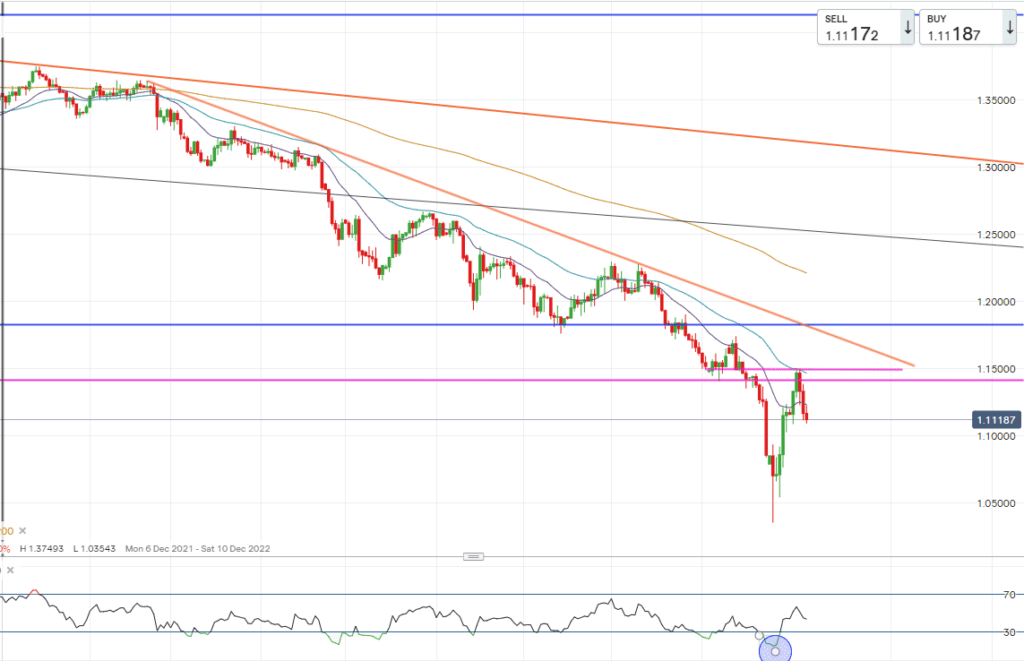
GBP/USD Daily Chart – 07/10/22
We saw a mild retracement from the swing low of 1.0355 to bounce back to the 1.1497 level where it was met by selling pressure placing the bears back in control of this market. An old market technician’s adage, “the trend is your friend until it isn’t”.
Let’s explore this further. Prices bounced back significantly from the 1.3055 low to 1.15, however resistance was faced at the 1.15 level which highlights a higher low in the current down trend. This could be a signal that this trend could be continuing to the downside. Should this bearish trend continue, we will need to see a close below 1.07 to confirm the trend is still intact. In addition, the rejection of the 1.15 level shows market participants are eying key levels, for example on the daily chart the 50-day EMA acted as resistance alongside the previous closing lows highlighted by the upper pink line. The lower pink line of resistance is the swing lows from March 2020, as highlighted by the weekly chart. This shows sellers are prepared to enter the market at this level to sell the pound. In addition, this selling pressure pushed cable below its 20-day EMA further adding to the strength of this downtrend.
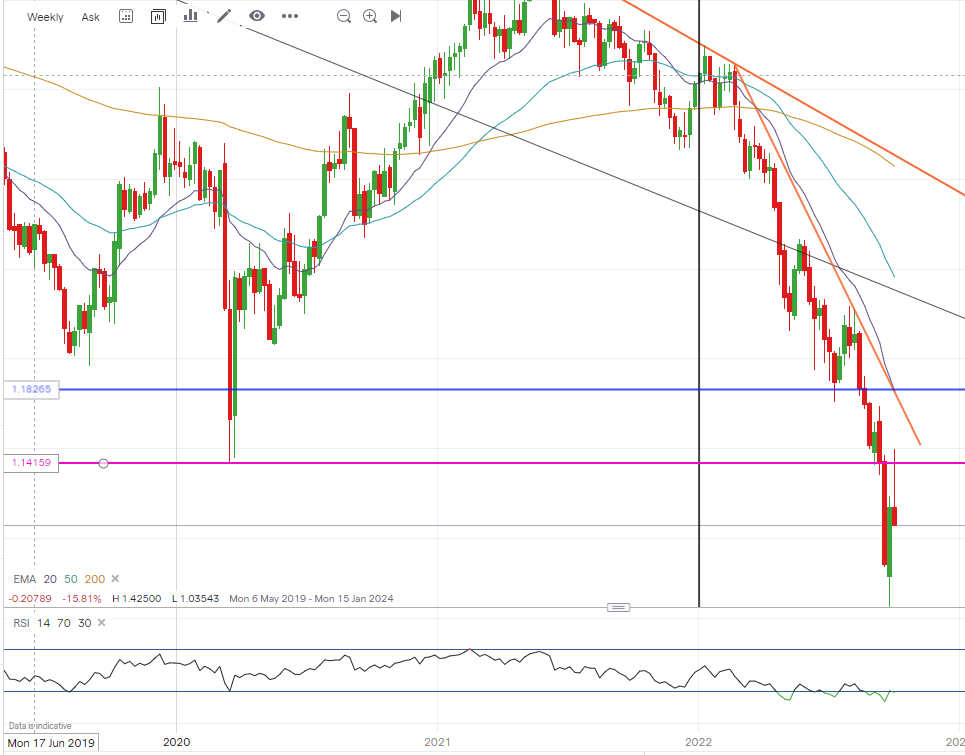
GBP/USD Weekly Chart – 07/10/22
Should this continue to make new lows or even new closing lows one can use an option strategy to potentially capitalise should this market fall further.
Buy a Put Spread
Trade Summary
Total 146 pips @ $6.25 per pip = $912.5
Potential profit: Should the market at expiry close at or below 1.05, the profit potential is 600 pips (600 x $6.25 = $3,750.00)
Written By