Oil - Fuelling Volatility
With global energy markets in focus due to tensions with Russian gas supplies to Europe, persistent elevated inflation rates across the western world, and a small reduction of output of a 100,000 barrels per day from OPEC, we have been taking a closer look at the charts.
Below is the weekly chart of US oil WTI. After the 29.67% retreat from the June 2022 highs, we have witnessed a 5-week consolidation phase between $97.15- $85.40 and the price is now at a pivotal point of support.
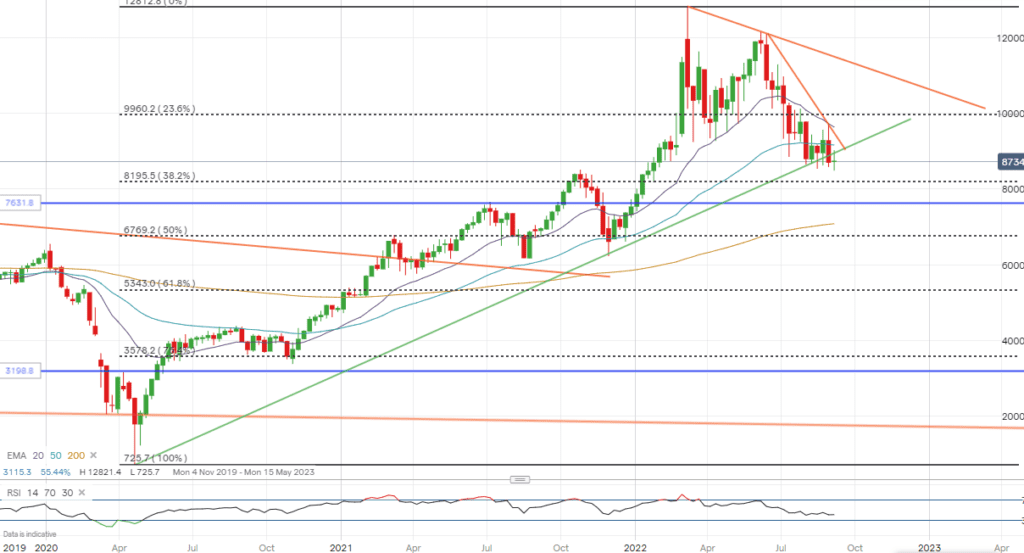
WTI is now currently resting at trend support, the lows of the consolidation zone ($88-$85.40), highlighting demand at the lower levels of $88 and adding to a potential supportive bullish bias. Should this trendline line hold due to the 100k barrels cut in oil output, there could be further scope for higher prices in the medium term.
If this is the catalyst for higher prices, short term resistance can be found at the following levels $90.15, $91.20 and $94; and any further advances above the $95.71 could see further advances past the $100 level.
Firm resistance levels could pose a threat to any advances. At present we are amid a double top formation, which by its nature is a reversal pattern and could potentially be reversing the trend from the April 2020 lows. If a rally then fails at these levels this could highlight that the bears are in in control of this market which then could question the integrity the rising trend, potentially seeing prices as low as $65. Today’s price action shows that the yesterday’s high of $90.16 acted as resistance, seeing prices fall 2.75% today.
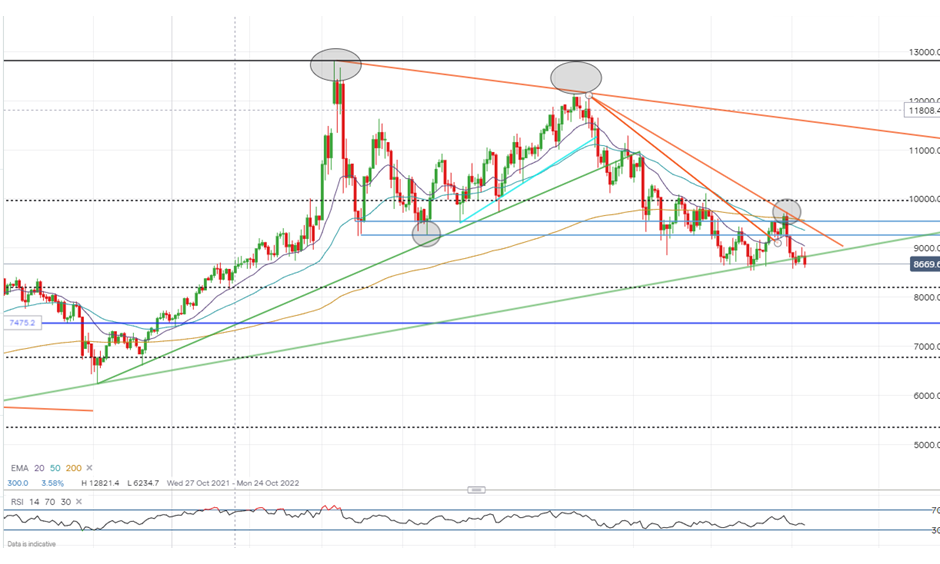
Should this market close below the $86.70, the closing low of the move from June’s highs, this would be suggestive of a new closing low of this counter trend, stressing that this counter trend is intact.
Couple this with a break of the rising trend and that we are amid a potential reversal pattern may show that the bears are holding this market. If this market falls key supports are $85.50, $81.95 $76.30, $67.70.
The following trade idea might be of interest:
Long Straddle
Trade Summary
07/09/22
Buying a December 22 WTI $87 call and simultaneously buying a December 22 WTI $87 put to create a straddle.
1 contract = $15.50 (straddle price) x 1000 = $15,500
Written By