Is Gold Losing Its Shine?
14-09-2022
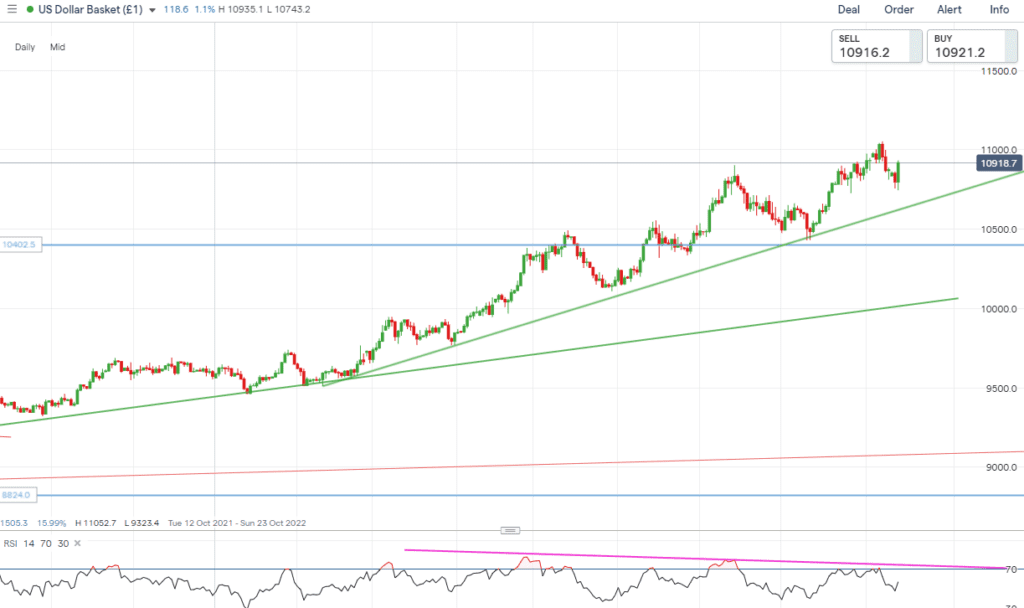
The dollar has seen an impressive run in 2022 seeing the Dollar index (DX) rise as high as 16.8%. This has been driven by a multitude of factors including the war in Ukraine and persistent high global inflation which has led global central banks to raise interest rates to fight the rise in prices. In addition, the dollar’s dominance as a global reserve currency, which accounts for 25% of global GDP, has exacerbated this move to the upside.
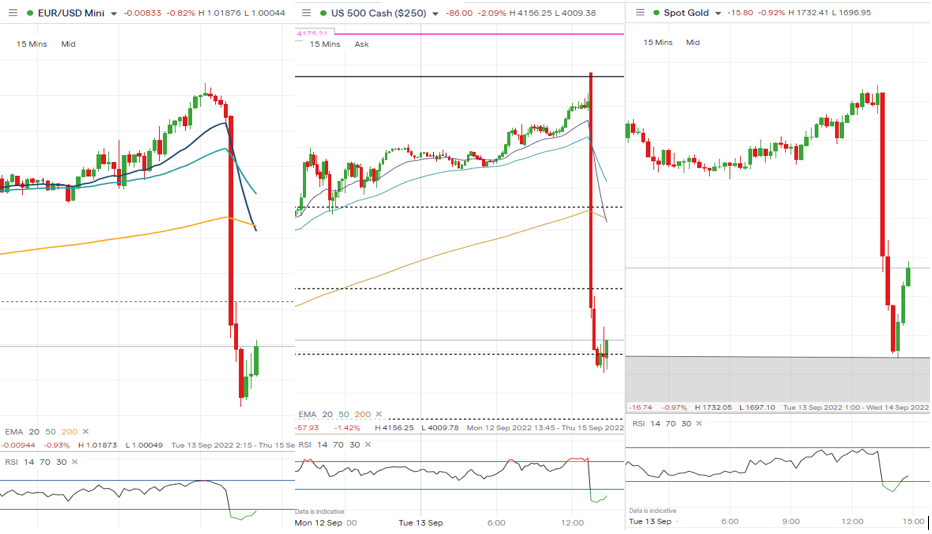
With inflation being the biggest driver of dollar strength, today’s (13/9/22) US CPI print came in slightly higher than expected with the month-on-month figures coming in 0.1% higher, and the year-on-year August at 0.2% higher than expected at 8.3% versus expectations of 8.1%. The market reaction was clear, we saw a snap back of the dollar after a week of declines; equities fell fast wiping out nearly 50% of the recent rally from September’s lows; and gold followed the pursuit to the downside on the back of the dollar bid.

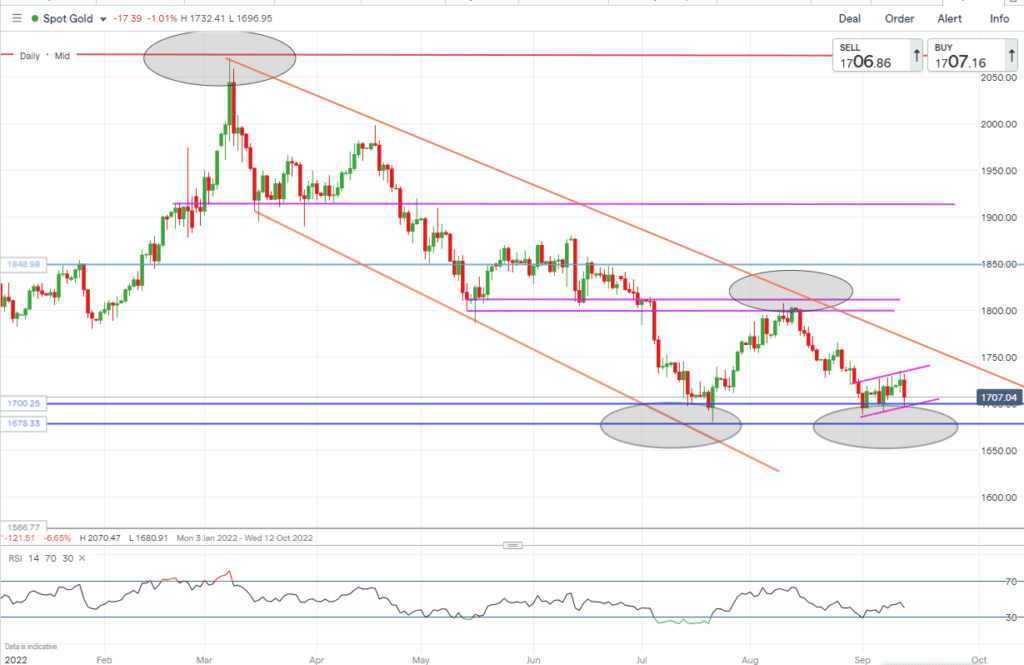
The move in gold has been rather surprising considering it was once seen as an inflation hedge. This has been far from reality in 2022. Since gold’s high on the 8th of March of $2070.47 we have seen it retreat 18.8% with a swing low of $1680.91. US inflation hitting 8.3% has resulted in a strengthening dollar, pushing the precious metal to a recent low of $1696.95, breaking the key $1700 level.
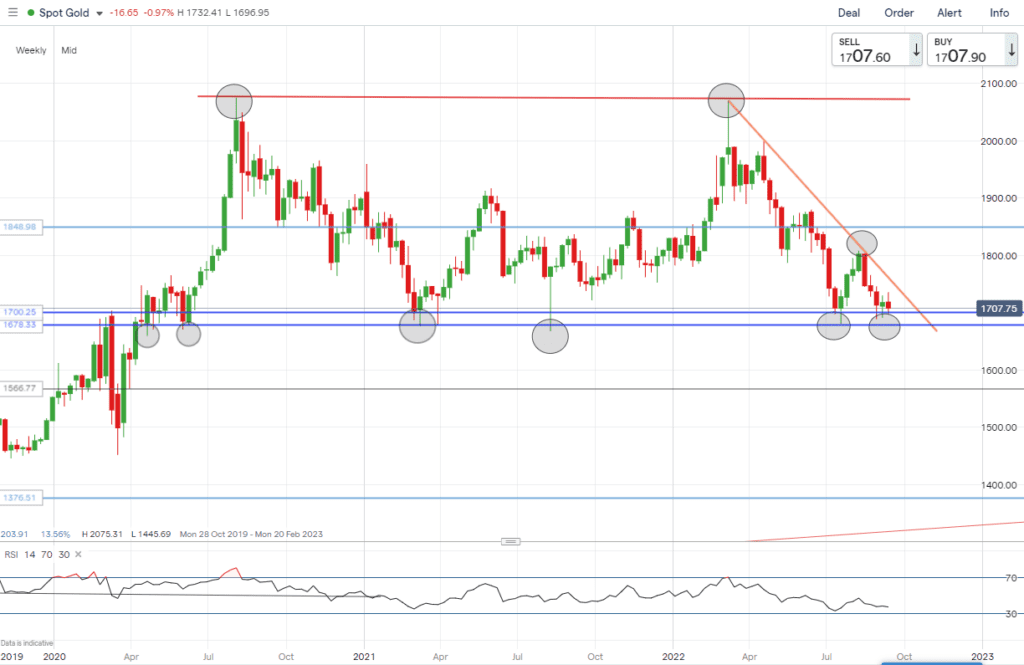
Gold is currently testing a major support zone $1700/$1678 which will have trader’s attention. Below is the weekly chart highlighting how this zone has been supporting the gold price since April 2020, with six touches of this zone stressing its importance.

What’s next for the precious metal?
Let’s build in some scenarios. The dollar seems to be the biggest catalyst for many asset classes, for example dollar [tooltip tip=”The price at which a buyer is willing to buy an option or a stock.”]bid[/tooltip], equities commodities [tooltip tip=”The price at which a seller is offering to sell an option or a stock. Also known as ask or ask price.”]offered[/tooltip], which has certainly been the trade for the year so far.
Looking at this scenario, this could be bearish for the yellow metal. The underlying trend in the DXY is bullish. Today’s inflation figures added support to this trend which could see the DXY hit new highs. If this is the case this could add support to a bearish move in gold taking it below the strong support zone exhausting the bulls.

To add to further bearishness gold has been consolidating, building a [tooltip tip=”A flag is a small rectangle pattern that slopes against the previous trend. If the previous move was up, then the flag would slope down. If the move was down, then the flag would slope up. Because flags are usually too short in duration to actually have reaction highs and reaction lows, the price action just needs to be contained within two parallel trend lines.
The flag pattern is used to identify the possible continuation of a previous trend from a point at which price has drifted against that same trend. Should the trend resume, the price increase/decrease could be rapid, making the timing of a trade advantageous by noticing the flag pattern”]bearish flag formation.[/tooltip] This is typically a trend continuation pattern. If this scenario holds and gold does snap below support, the measuring target of gold would see it test the $1575 level and could see the DXY tests 20 year highs.

Inversely, should this short term move fizzle out and the DXY continues its retreat breaking the rising trend, this should translate into a bullish move for gold as it still currently resides at a pivotal point of technical support. If this is the case short term resistance resides at $1734 and the big figure of $1800. This move could be dependant on the markets seeing a softening in the inflation figures and a more dovish response from the Federal reserve. Should this materialise and the $1800 level be breached convincingly, this could certainly reverse the current down trend in gold which could strengthen as a function of softening in the dollar.
Long ATM Call Spread
Bullish Gold?
Long at-the-money Call Spread in Gold with a net debit of $31 ($3100)
Long ATM Put Spread
Bearish Gold?
Long at-the-money Put Spread in Gold with a net debit of $32.5 ($3250)
