Global Market Turmoil: FTSE 100 Technical Review
06/08/24
Not a great start to trading post weaker US non-farm payroll manufacturing PMI data last Friday. Rate cut expectations are now pointing towards deeper and faster cuts, highlighting to potential of a recession in the world’s largest economy. The catalyst to kick off the global equity sell rout was the NIKKEI 225 falling close to 13% to 30380 on Monday, closing on Friday at 34807. This fed through to European futures markets and saw the FTSE September futures fall as low as 7908 on Monday’s trade, levels not seen since April this year.
Technical FTSE Daily
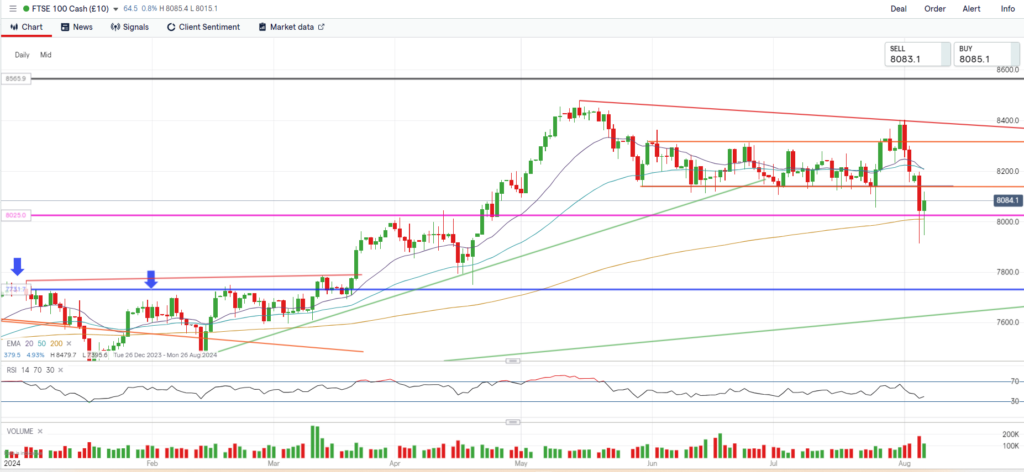
FTSE saw 2 false breakouts of a well-established trading range from 30th of May. The first on the 25th of July where the FTSE fell to 8055 before rallying to close the day 8205. This first false break paved the way for the second on 31st July, closing well above the range only to see it fall back within that range in two trading days.Once again, the 8040 level breached and saw selling pressure push the market as low as 7913 on the cash where the FTSE found support rallying to close just slightly above the 200 day moving average, which has not been tested since February this year. Should this rebound continue, what was once support becomes resistance so the FTSE may find problems trying to overcome 8140 level. Should recession fears continue to worry markets, alongside potential further unwinding of the crowded Yen carry trade key, support levels come in at 8000, 8025, 7835, 7920 and 7730.
At time of writing the FTSE is hovering slightly above the 8025 support, highlighted by the pink line on the chart. This area of support may act as pivotal price point, and we could see the market hold this level thus creating a higher low for the underlying uptrend which could be suggestive of a higher market. Key resistance resides at 8140, 8200, 8300 and the recent reactionary high 8400.
Dependant on your view there are a number of options strategies that may be worth considering
If bullish, you could consider buying outright calls or call spreads; and if bearish an outright put or a put spread.
FTSE 100 year-to-date indicating resistance and range

The contents of this article are for general information purposes only. Nothing in this article constitutes advice to any person and any investments and/or investment services referred to therein may not be suitable for all investors. If you’re unsure whether any investment is right for you, you should contact an independent financial adviser. For more information, please see IMPORTANT DERIVATIVE PRODUCT TRADING NOTES.


