Middle East Tensions: Oil Prices and Market Uncertainties
20-10-23
Despite multiple OPEC+ cuts to production, the global benchmark WTI Crude Oil price has remained below $100/barrel for a sustained period due to reduced demand in many of the world’s largest oil consuming countries as higher interest rates and a strong US dollar dampen economic activity.
However, the current conflict in the Middle East has heightened concerns about potential supply disruption across both production and logistics.
The International Energy Agency has clarified that current supplies remain stable. However, the rapid intensification of the situation means that markets are poised for a potential breakout to the upside.
Container xChange’s CEO, Christian Roeloffs, expressed concerns about the potential disturbances to pivotal routes like the Suez Canal, vital for numerous commercial ships including VLCCs. The Strait of Hormuz, central to oil and gas transport, might also experience disruptions, with the magnitude of impact contingent on the conflict’s progression and longevity.
Moreover, several global companies with a presence in the Middle East have been forced to adjust their operations. Chevron, the second-largest U.S. oil and gas producer, has been directed to shut down the Tamar natural gas field.
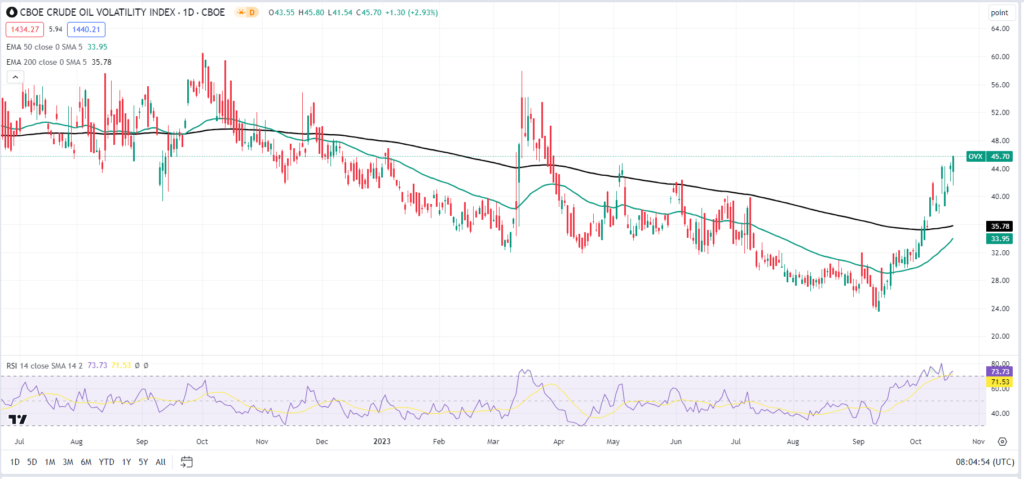
The real question is, has the market already priced in this volatility? Looking at the OVX Crude oil volatility index chart below we can see from mid-September there has been a significant move to the upside in crude volatility, but so far, any break above $90 has been short-lived (see Chart 2 below).
CHART 1 – CBOE CRUDE OIL VOLATILITY

These recent geopolitical developments could further pressure global supply, potentially making this the tipping point for WTI Crude to finally break the $90 level and rally towards $100.
Should this occur, this will be problematic for the global economy as central banks around the globe are having to deal with high and persistent inflation, adding to the “higher interest rates for longer” narrative. With energy one of the biggest drivers of inflation there is a real need to keep these prices suppressed, but the US’s Strategic Petroleum Reserve is at historically very low levels and therefore extra supply from the US cannot readily be added.
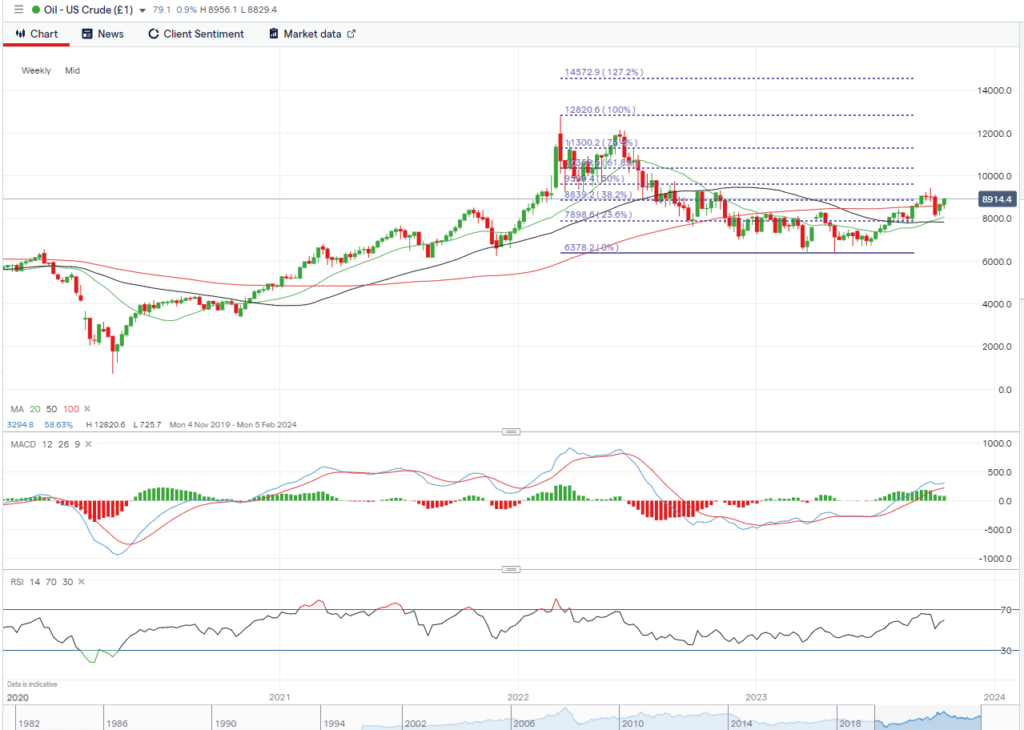
CHART 2 – WEEKLY WTI CRUDE TECHNICAL ANALYSIS

Looking at the weekly WTI Crude chart, the 20-day MA (Moving Average) has crossed the 50-day MA which is indicative of a bullish move to come. Moreover, the price is now above the 100-day MA too. $90 a barrel is a key level. Should crude sustain a close above this level this may become the new support level. The next key technical level is at $96, being the 50% fib retracement level. Many participants will be keen to see how price behaves at this key technical level. If the upward current trend continues, the next levels of resistance are $103-$113, and then onto $128 – the swing high from WTI’s highest crude level at $128.20 which we last saw back in March 2022.
KEY RESISTANCE (IN US$)
90
95.99
103.59
113
KEY SUPPORT (IN US$)
78.98
63.78
How to gain exposure to Crude Oil
For investors who are looking for exposure to this market and to take advantage of what could be a further move to the upside, using options can be a cost-effective way to do this.
Crude Oil Options on Futures
Compared with futures contracts, trading options on crude oil is a lower risk and less capital-intensive adverse way to gain exposure to this product:
- your cost of buying the option is the upfront cost and your potential loss is limited to what you paid for the option.
- trading in futures contracts requires a daily mark-to-market margin call, which is not the case for bought options.
- the initial margin requirement of futures is higher than the premium required for the option on a comparable exposure
- options positions provide more leverage
| WTI Crude Oil Futures/Options | E-Mini WTI Crude Oil Futures/Options | Micro WTI Crude Oil Futures/Options | |
|---|---|---|---|
| Contract Size | 1,000 barrels | 500 barrels | 100 barrels |
| Ratio to Standard Contract | 1 | ½ | *1/10 |
| Minimum Tick Increment | $0.01 per barrel | $0.025 per barrel | $0.01 per barrel |
| Dollar Value of One Tick | USD 10 per contract | $12.50 per contract | 1 per contract |
| Settlement | Physical | Financial | Financial |
Options on Crude Oil ETFs
Crude Oil ETFs track the price changes of crude oil, allowing investors to gain exposure to this market.
The oil ETF with the lowest fees and most Liquidity is the United States Oil Fund LP (USO). USO is structured as a commodity pool and is designed to mirror the percentage change in the spot price of WTI crude. The contract is traded on the New York Mercantile Exchange (NYMEX). USO invests in other oil-related contracts and may invest in forwards and swap contracts.
Trading options on this contract is a cost-effective way of gaining exposure to oil with the underlying notional value being a lot smaller than options on crude futures.
Options on Oil-Related Equities
Another way to gain exposure to crude oil is by trading the companies which directly deal in and are affected by this commodity. Most notably in the UK, BP Plc is one of the most commonly traded stocks, and with a share price at around £5.50 it’s also a low notional value to trade options on.
Other popular stocks include Shell Plc; and in the U.S, Chevron (CVX) Occidental petroleum (OXY), Exon Mobil (XOM) and ConocoPhillips (COP), all of which benefit from a liquid options market.
Investors can trade in these equites and use options as an overlay to generate additional income as they look to enter and exit positions in the underlying equities.


